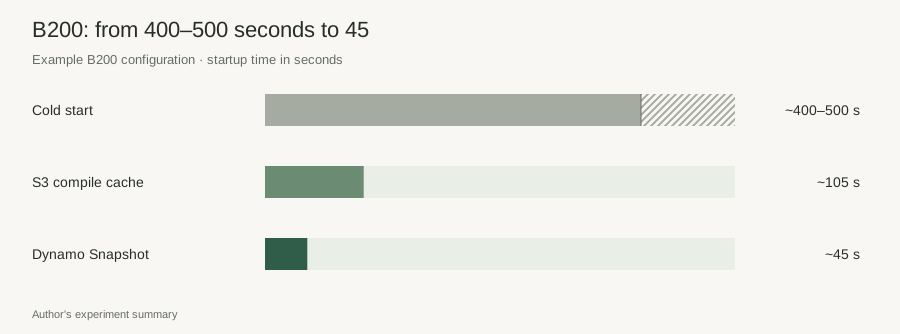
I cut B200 worker startup from roughly 400–500 seconds to about 105 using an S3 compilation cache, then down to about 45 with NVIDIA Dynamo Snapshot.
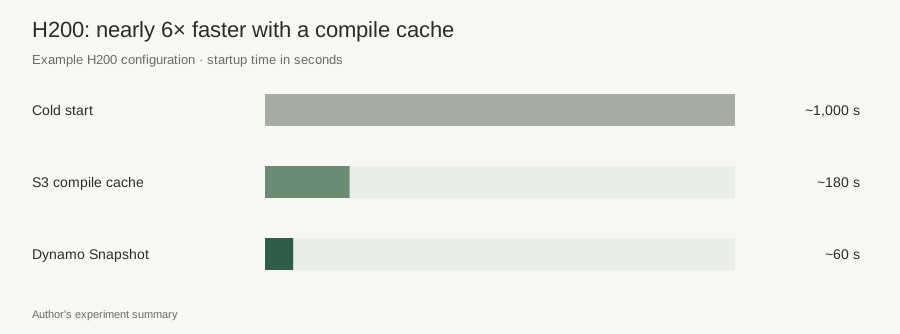
On the H200 setup, I went from approximately 1,000 → 180 → 60 seconds. The compile cache alone made startup about 5.6× faster—nearly sixfold.
These numbers come from two different vLLM startup experiments I ran on different GPUs and model configurations. The absolute times varied, but the startup sequence was the same: initialize the runtime, load the model, prepare kernels, and capture CUDA graphs before the worker could accept traffic.
I built a compilation-cache registry in S3 so workers on different nodes and providers could reuse the artifacts. I also integrated GPU process checkpointing into the cluster, which preserved more of the initialized worker state than a set of cache files could.
Where the startup time went
A cold worker has to finish several steps before it can serve. It needs the container image, model weights, a CUDA context, compiled kernels, captured execution graphs, and a serving process ready for requests. Pulling the image and downloading weights were obvious costs. In my slowest configurations, though, compilation and graph preparation took up most of the wait.
torch.compile converts model operations into optimized code, and specialized kernels like GEMM may need their own compilation and preparation. CUDA graph capture is a separate step that records execution for replay. Capturing many sizes adds more startup work. A worker with all weights on disk could still spend minutes on these steps.
That delay affected how I could scale. If capacity takes minutes to come online, a rising queue leaves me little room to react. I had to start workers well ahead of time or keep extra GPU capacity idle. Shorter startup times meant I could bring capacity online sooner as demand grew.
First, make compilation reusable across providers
I started with the compilation cache. My workers could run with different providers, so a local directory on one node wasn't a useful way to share artifacts. S3 gave me a common place to publish them and retrieve them wherever the next worker was scheduled.
I ran the target model and serving setup on the producer node, let it finish compiling, and saved the resulting artifacts. When a new worker came up, it pulled the matching archive before the inference engine started. I could prepare these bundles ahead of time for the model and GPU combinations I expected to run.
The cache key had to be precise. A model name doesn't tell you what code is actually running. I built the identity from the launch arguments, model ID, container version, CUDA runtime, host driver and CUDA compatibility, and the GPU configuration.
| Identity input | Why it belongs in the key |
|---|---|
| Model and revision | The computation being compiled |
| Launch arguments | Execution mode and compilation settings |
| Container and runtime | The engine, libraries, and generated code |
| CUDA and host driver | The software environment on the target node |
| GPU configuration | The hardware the artifacts were prepared for |
Hashing that set of parameters let me pick the right artifact without binding it to a specific machine or cloud provider. H200 and B200 setups got their own artifacts. If the runtime or launch config changed, the key changed, so the worker grabbed a different cache instead of reusing a stale one.
What the cache removed
On the H200 setup, startup dropped from roughly 1,000 to 180 seconds, which is about 5.6× faster. On B200, it went from about 400–500 to 105 seconds, a roughly 3.8–4.8× speedup across that baseline range.
With compilation out of the way, the remaining startup time was easier to break down. The process still had to boot, load weights, initialize the engine, and handle anything the cache didn't cover. Loading the compiled artifacts doesn't restore a live CUDA graph or the process memory it points to.
Where the container image lived also affected the total. With the image already on the node, cache-based startup could be around 120 seconds. On a fast storage path, fetching weights could take about 5–10 seconds. These numbers depend on the local setup; they show why an image-warm worker starts sooner, but they aren't another H200 vs. B200 comparison.
Then, preserve the prepared worker
I added NVIDIA Dynamo Snapshot on top of that, using GPU memory checkpointing. I wired the GPU nodes into the Kubernetes cluster and stood up the checkpoint-and-restore path next to NVIDIA GPU Operator and Dynamo.
The two tools underneath do different things. cuda-checkpoint moves CUDA state into host memory so it can be captured. CRIU—Checkpoint/Restore in Userspace—saves the Linux process state. Dynamo's snapshot agent coordinates the capture and restore on the node. That lets a later worker resume from the saved process image.
Checkpoint producer
- Start the model and load its weights.
- Compile kernels, capture graphs, and warm up.
- Checkpoint the prepared CUDA and process state.
- Store the snapshot for reuse.
Restore path
- Select the compatible snapshot.
- Make its files available to the target node.
- Restore the process and CUDA state.
- Resume the serving lifecycle and become ready.
I kept the snapshots in S3 or on cluster storage. S3 worked for moving artifacts around; cluster storage gave the restore process a nearby source. An object sitting in S3 still needs to be transferred and handed to the restore tools, so where it's stored changes how long the restore takes.
The snapshot captures a state much further along in startup than the compile cache. By the time the process is captured, model construction, loading, and preparation are already done. Restore reads that state back and resumes from there, skipping the initialization steps that the cache-based path still had to run.
Two configurations, two startup profiles
With Dynamo Snapshot, the H200 configuration started in approximately 60 seconds, versus about 180 seconds with the compilation cache alone. On B200, the corresponding time was approximately 45 seconds, down from about 105.
| Configuration | Cold start | Compile cache | Dynamo Snapshot |
|---|---|---|---|
| H200 | ~1,000 s | ~180 s | ~60 s |
| B200 | ~400–500 s | ~105 s | ~45 s |
Across the full progression, the reported startup time dropped by approximately 16.7× on the H200 configuration and 8.9–11.1× on B200. The intermediate step did real work: caching compilation removed a large repeated cost, and checkpointing then skipped more of the work needed to reconstruct a running engine.
These numbers cover worker startup on existing GPU nodes. Provisioning a new machine and joining it to the cluster are separate steps. If the image is missing, it still has to be pulled, and a remote checkpoint still has to be read. A snapshot shortens the path to a serving worker, but it does not eliminate those transfers.
Compatibility and storage set the boundary
A compile cache stores generated code. A process snapshot stores that code plus the execution state around it. That puts the runtime environment into the artifact's contract: the image, libraries, driver, GPU, and model configuration all have to match the supported restore path.
I kept separate configurations for each piece of hardware I used. The H200 result does not mean an H200 process snapshot can be restored on B200. Saving the snapshot somewhere shared also does not guarantee a fast restore. Once compilation is out of the critical path, storage throughput and image availability become much more visible.
Operationally, the main change was the shorter gap between deciding to scale and having another worker ready. With demand growing, I could start scaling before the queue built up and bring capacity online sooner. That moved the setup closer to serverless behavior: adding capacity as demand grew, with less need to hold idle nodes just to cover a long initialization delay.